After 18 months of operation, the power plant has finally produced almost as much energy as TVA originally predicted it would produce every 12 months (5.8 million KWh produced versus 6 million KWh goal). Although TVA's inconsistent reporting periods makes it so WE don't know exactly how much energy was produced over the last 12 months, we do know that over the last 13 months (from beginning of April 2001 through end of April 2002), the power plant produced 4.6 million KWh. This (4.6 million KWh) is coincidentally equal to TVA's new goal for every 12 months. So, the power plant is not on track quite yet.Repeated Comment: TVA should provide detailed data similar to what the Wisconsin Wind Project provides for a couple similar size turbines, or what TVA provides for their own solar stations (scroll down to see plots at both sites). The Wisconsin Wind Project also provides data on electric power consumed by the equipment. While the 6-10 kw consumption is small relative to rated power (~600 kw), it does remind us that the wind power plant relies on conventional power sources providing "extra" power when the wind is not blowing hard. This also reminds us that TVA's updates are not precise about their reported "generation." Is it gross or net?
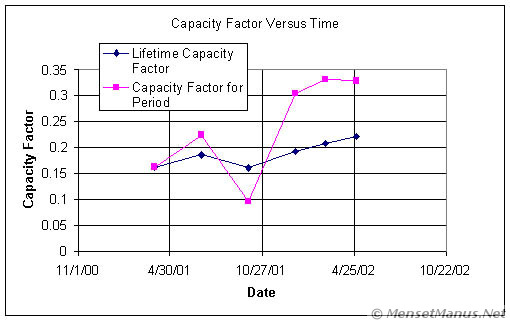
In the most recent two months, TVA produced about 0.95 million kilowatt-hours, for a two-month (61 days) average capacity factor of just under 33%. This raises the overall capacity factor so far to about 22%, which is still well below the new goal of 27%. Will they maintain the increasing trend? Or, will the wind slack off again this summer, like it did last summer? TVA already has the data for May and most of June, so they already know, but it's still their secret. Stay tuned.
Comments on a few items in the recent TVA newletters:Back in the Spring Newsletter, TVA played up how Johnson City was celebrating their assimilation into the Green Power program. This is interesting because Johnson City is in the same area where residents fought to stop the wind power plant. Apparently Johnson City wants "Green" power, but they don't want it to be produced in their back yard.
Also mentioned was that the University of Tennessee, Knoxville, which is supposedly suffering from lack of funding, signed up to pay extra for their electricity. In the recent Summer Newsletter, TVA is now proud to announce that the Tennessee Governor and the State of Tennessee, which is supposedly so short of money that they want to institute an Income Tax, also signed up to pay extra for their electricity. Apparently they think it is better for the electricity to be a little "Green" than for some more students and taxpayers to afford education or other government services, which will be sacrificed (however slightly) to pay the "Green" power bill.