[Home] [Windpower Home Page] [Regenesys Dangers] [Directions] [Troubles Nearby] [Dirty] [FOIA] [Ground Zero] [Tour] [Friendly?] [Spinnin'] [Bottom Line - Performance] [Power Calculator] [Basis] [Storage] [Assembly] [Construction] [18 Operating] [Area History] [California Dreamin'] [Texas]

Common sense isn't.

Performance of TVA's Buffalo Mountain Wind Power Plant

The Bottom Line

October 2, 2002

For data recently released by TVA, through July 31, 2002

Capacity Factor versus Time
The figure above and table below summarize the plant's electricity production to date, based on the most recent update from TVA. TVA has been reluctant to provide timely or detailed information about the performance of their wind power plant, but some information is slowly accumulating. Recently, the plant has suffered during the summer slack in wind, which is probably why TVA released these results for 3 months of production, after releasing data for 2 months periods, for the previous two reports.

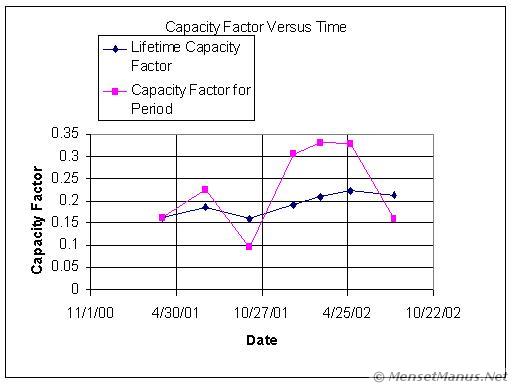
TVA has finally released more wind energy production data. The plot and table below provide a summary of the historical performance.

Could it be possible that TVA would adjust their reporting of the wind power plant's energy production data to make it look better than it would look with objective reporting? Could it be possible that TVA would call a facility "green" and good for the environment regardless of the possible consequences of an accident at the facility? It appears that the answer to both questions is "yes."

One thing that stands out in the latest data is the energy production milestone that was finally reached. The plant has finally produced over 6 million kilowatt-hours. It only took about 19 to 21 months to produce the amount of energy that TVA originally said (and still displays on some web pages) they would produce each year. [Update August 21, 2004: TVA's web sites now say 4.6 million kwh/year, but still said 6 million as of late 2003.]

In 2001, TVA reported wind energy production data for periods ending at the end of March, June, September, and December. Although the reporting was delayed significantly each time, at least they followed a conventional, regular, quarterly pattern. In 2002, TVA has used an irregular pattern of reporting by giving data for periods ending at the end of February (2 months), April (2 months), and now July (3 months). As usual, the reporting was delayed each time.

What does this irregular and infrequent reporting accomplish? For one thing, we have very few data points. After one more month, the windmills will have been operating for over 24 months, but we have only 7 data points. In addition, we can't make good year-to-year comparisons of energy production, because we don't have comparable data. Another thing this irregular reporting accomplishes is to mask or minimize the appearance of large fluctuations in production. If you report every two months during windy months, but only every 3 months during slack months, the numbers don't look as drastically different to the casual observer.

Another thing that is NEVER seen with this infrequent reporting is how often, and for how long at a time, the plant produces essentially zero power. I have a small windmill in my front yard, and it often sits still for minutes or hours, or occasionally for days, at a time. The wind on Buffalo Mountain is surely more dependable, but from watching the weather data (scroll down for graphs), I know that even there the wind can remain fairly low for days in a row. By only reporting every two or three months, TVA doesn't let us see how bad these "dry" periods can be.

Of course it would be more relevant to examine the economics of the wind power plant, but TVA doesn't seem to publicize that data at all.


Date
Actual
Total
Production
Million
Kilowatt
hours
Theoretical
Capacity
Million
Kilowatt
hours

Lifetime
Capacity
Factor
%
Capacity
Factor
For
Period
%
Days
Since
Start
November 1, 2000 - "Operational Date"
(Actual Start of Operations - Oct. 12)
0
0
n/a
n/a
0
March 31, 2001
1.2
7.2
16
16
151
June 30, 2001
2.1
11.5
19
22
242
September 30, 2001
2.6
15.9
16
9
334
December 31, 2001
3.9
20.2
19
30
426
February 28, 2002
4.8
23.0
21
33
485
April 30, 2002  
5.8
25.9
22
33
546
July 31, 2002  
6.4
30.3
21
16
638

Previous Bottom Line Reports:
June 2002
April 2002
March 2002
January 2002
November 2001

Get Free. Get LibreOffice.
Distributed Computing

Quote of the moment
[T]he facility and excess of law-making seem to be the diseases to which our governments are most liable . . .
~ (James Madison) Federalist, no. 62 ~
Thanks to Highland Media

[Home] [Windpower Home Page] [Regenesys Dangers] [Directions] [Troubles Nearby] [Dirty] [FOIA] [Ground Zero] [Tour] [Friendly?] [Spinnin'] [Bottom Line - Performance] [Power Calculator] [Basis] [Storage] [Assembly] [Construction] [18 Operating] [Area History] [California Dreamin'] [Texas]

Common sense isn't.

DuckDuckGo Site Search

Images stored locally for protection of your privacy (unless/until you search with Google).

Disclaimer Fine Print: This site is personal, and is independent of TVA or any other organization. Use of the abbreviation "TVA" is purely for descriptive purposes (for example, to distinguish from wind power plants on Buffalo Ridge in Minnesota). No endorsement, no approval, and no involvement by TVA is implied.

Copyright © 2000- hal9000[zat]mensetmanus.net
I last touched this page on Saturday, 2007-11-17 at 05:09:06 UTC.

Join the Blue Ribbon Online Free Speech Campaign!
W3C Markup Validator Check
Site optimized for any modern browser, any size screen, any resolution, and no plug-ins; prepared and served with Free BSD, and Debian GNU / Linux