[Home] [Windpower Home Page] [Regenesys Dangers] [Directions] [Troubles Nearby] [Dirty] [FOIA] [Ground Zero] [Tour] [Friendly?] [Spinnin'] [Bottom Line - Performance] [Power Calculator] [Basis] [Storage] [Assembly] [Construction] [18 Operating] [Area History] [California Dreamin'] [Texas]

Common sense isn't.

Performance of TVA's Buffalo Mountain Wind Power Plant

The Bottom Line

April 19, 2003

For data recently released by TVA, through January 31, 2003

Capacity Factor versus Time
The figure above and table below summarize the plant's historical electricity production, based on the recently released update from TVA.

As always, TVA refuses to provide timely or detailed information regarding the performance of their wind power plant, even when requested under the Freedom of Information Act.

TVA's latest newsletter also celebrated NREL congratulating TVA and other utilities for their successes with "green pricing" programs to help customers pay extra to support "green" power.  In other recent local news, TVA and Invenergy are trying to avoid paying the normal $249,000 annual county property taxes for their $25 million wind power plant expansion.  These power plants are so "good" for our environment that we should not only volunteer to pay extra for them, but we should forego any local tax money for hosting them?! 

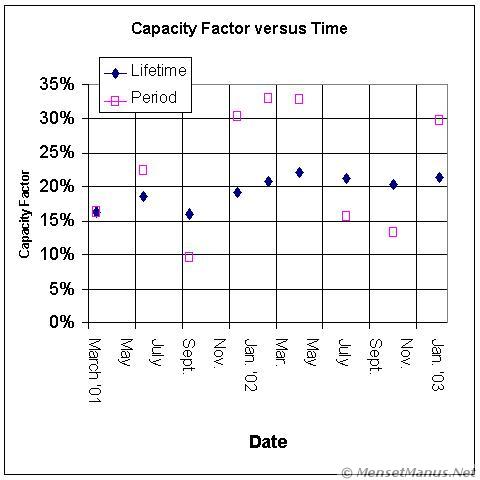
The latest reported (November 2002-January 2003) quarterly energy production was one of the better performances of the meager 9 data points released by TVA over approximately 27 months of operations (November 2000-January 2003).  Still, it seems that in the last 12 months only approximately 4 million kilowatt-hours were produced.  This annual figure is approximate, since TVA reported data on different months each year, apparently to intentionally make comparisons difficult.  This compares with TVA's original goal of 6 million kilowatt-hours per year, and the revised goal of 4.6 million kilowatt-hours per year.  Over about 2.25 years, total energy production has averaged only approximately 3.7 million kilowatt-hours per year.

Also noteworthy this quarter:  Of the total approximately 8.65 million kilowatt-hours of "green" energy produced this quarter at all the Green Power plants, approximately 84.3% was from landfill and sewer gas burned in fossil power plants, 15% was from wind power, and the remaining 0.7% was from solar panels.  Despite this data, the order is almost always reversed in newspapers and other advertising materials that say the Green Power Switch program "gets its electricity from such renewable sources as the sun, the wind and landfill gases."  In essence, burning landfill and sewer "natural" gas, and calling it "green," produced more energy this month alone (7.3 million kilowatt-hours) than the windmills had produced over their previous 24 month operating history. If you think you're helping the environment by buying this "green" power and producing less CO2, then you're badly mistaken.


Date
Actual
Total
Production
Million
Kilowatt
hours
Theoretical
Capacity
Million
Kilowatt
hours

Lifetime
Capacity
Factor
%
Capacity
Factor
For
Period
%
Days
Since
Start
November 1, 2000 - "Operational Date"
(Actual Start of Operations - Oct. 12)
0
0
n/a
n/a
0
March 31, 2001
1.2
7.2
16
16
151
June 30, 2001
2.1
11.5
19
22
242
September 30, 2001
2.6
15.9
16
9
334
December 31, 2001
3.9
20.2
19
30
426
February 28, 2002
4.8
23.0
21
33
485
April 30, 2002  
5.8
25.9
22
33
546
July 31, 2002  
6.4
30.3
21
16
638
October 31, 2002  
7.0
34.7
20
13
730
January 31, 2003
8.3
39.1
21
30
822

Previous Bottom Line Reports:
December 2002
October 2002
June 2002
April 2002
March 2002
January 2002
November 2001

Get Free. Get LibreOffice.
Distributed Computing

Quote of the moment
There is a pleasure in the pathless woods; There is a rapture on the lonely shore; There is society, where none intrudes, By the deep sea, and music in its roar: I love not man the less, but Nature more.
~ Lord Byron, Childe Harold's Pilgrimage, Canto iv. Stanza 178. ~
Thanks to Highland Media

[Home] [Windpower Home Page] [Regenesys Dangers] [Directions] [Troubles Nearby] [Dirty] [FOIA] [Ground Zero] [Tour] [Friendly?] [Spinnin'] [Bottom Line - Performance] [Power Calculator] [Basis] [Storage] [Assembly] [Construction] [18 Operating] [Area History] [California Dreamin'] [Texas]

Common sense isn't.

DuckDuckGo Site Search

Images stored locally for protection of your privacy (unless/until you search with Google).

Disclaimer Fine Print: This site is personal, and is independent of TVA or any other organization. Use of the abbreviation "TVA" is purely for descriptive purposes (for example, to distinguish from wind power plants on Buffalo Ridge in Minnesota). No endorsement, no approval, and no involvement by TVA is implied.

Copyright © 2000- hal9000[zat]mensetmanus.net
I last touched this page on Saturday, 2007-11-17 at 05:09:06 UTC.

Join the Blue Ribbon Online Free Speech Campaign!
W3C Markup Validator Check
Site optimized for any modern browser, any size screen, any resolution, and no plug-ins; prepared and served with Free BSD, and Debian GNU / Linux