[Home] [Windpower Home Page] [Regenesys Dangers] [Directions] [Troubles Nearby] [Dirty] [FOIA] [Ground Zero] [Tour] [Friendly?] [Spinnin'] [Bottom Line - Performance] [Power Calculator] [Basis] [Storage] [Assembly] [Construction] [18 Operating] [Area History] [California Dreamin'] [Texas]

Common sense isn't.

Performance of TVA's Buffalo Mountain Wind Power Plant

The Bottom Line

December 18, 2002

For data just released by TVA in the last couple days, through October 31, 2002

Capacity Factor versus Time
The figure above and table below summarize the plant's historical electricity production to date, based on the update from TVA, which was just released within the last couple days. TVA remains reluctant to provide timely or detailed information about the performance of their wind power plant, and it's no wonder. This report marks the 2nd worst performance TVA has reported so far. Actual results may be even worse than appearances based on TVA's biased data reporting, but we won't know unless we can see more data than TVA has been willing to publicize.

TVA again released results for 3 months of production, possibly to continue making difficult any attempts at year-to-year comparisons.

While TVA's recent newsletter announced the "successful first audit" of the "green" power switch program, TVA also recently quietly announced cancellation of plans to build a Regenesys energy storage facility near the wind power plant. TVA apparently declined to explain the cancellation, but publicity about the associated dangers, and less than "green" appearances, may have played a part in the decision.

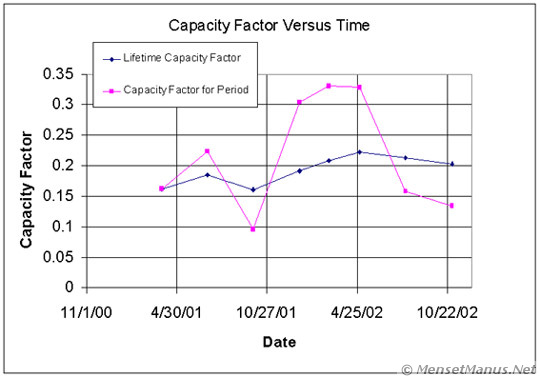
The data now extends for 24 months (2 years) of operations. Total energy production, at 7 million kilowatt-hours, is only 17% more than the 6 million that TVA originally predicted would be produced every 12 months! With a lifetime capacity factor of about 20%, TVA is producing less than 60% as much power (on average) as their original predictions, which were based on 35% capacity factor. Wouldn't you like to know how they could be so far off?!


Date
Actual
Total
Production
Million
Kilowatt
hours
Theoretical
Capacity
Million
Kilowatt
hours

Lifetime
Capacity
Factor
%
Capacity
Factor
For
Period
%
Days
Since
Start
November 1, 2000 - "Operational Date"
(Actual Start of Operations - Oct. 12)
0
0
n/a
n/a
0
March 31, 2001
1.2
7.2
16
16
151
June 30, 2001
2.1
11.5
19
22
242
September 30, 2001
2.6
15.9
16
9
334
December 31, 2001
3.9
20.2
19
30
426
February 28, 2002
4.8
23.0
21
33
485
April 30, 2002  
5.8
25.9
22
33
546
July 31, 2002  
6.4
30.3
21
16
638
October 31, 2002  
7.0
34.7
20
13
730

Previous Bottom Line Reports:
October 2002
June 2002
April 2002
March 2002
January 2002
November 2001

Get Free. Get LibreOffice.
Distributed Computing

Quote of the moment
Young men are fitter to invent than to judge, fitter for execution than for counsel, and fitter for new projects than for settled business.
~ Francis Bacon, Of Youth and Age. ~
Thanks to Highland Media

[Home] [Windpower Home Page] [Regenesys Dangers] [Directions] [Troubles Nearby] [Dirty] [FOIA] [Ground Zero] [Tour] [Friendly?] [Spinnin'] [Bottom Line - Performance] [Power Calculator] [Basis] [Storage] [Assembly] [Construction] [18 Operating] [Area History] [California Dreamin'] [Texas]

Common sense isn't.

DuckDuckGo Site Search

Images stored locally for protection of your privacy (unless/until you search with Google).

Disclaimer Fine Print: This site is personal, and is independent of TVA or any other organization. Use of the abbreviation "TVA" is purely for descriptive purposes (for example, to distinguish from wind power plants on Buffalo Ridge in Minnesota). No endorsement, no approval, and no involvement by TVA is implied.

Copyright © 2000- hal9000[zat]mensetmanus.net
I last touched this page on Saturday, 2007-11-17 at 05:09:06 UTC.

Join the Blue Ribbon Online Free Speech Campaign!
W3C Markup Validator Check
Site optimized for any modern browser, any size screen, any resolution, and no plug-ins; prepared and served with Free BSD, and Debian GNU / Linux